Your agent ran for 47 minutes. It consumed $12 of tokens. It returned nothing useful. Without logs, you have no idea why. Did it get stuck in a loop? Did a tool fail silently? Did the context overflow and the model start hallucinating steps? You genuinely cannot tell.
This is the production reality that most harness writeups skip. The model gets all the attention. The harness gets the blame when things go wrong, and zero credit when they don't. Observability is how you change that. It's what turns a black-box agent run into something you can actually debug, replay, and improve.
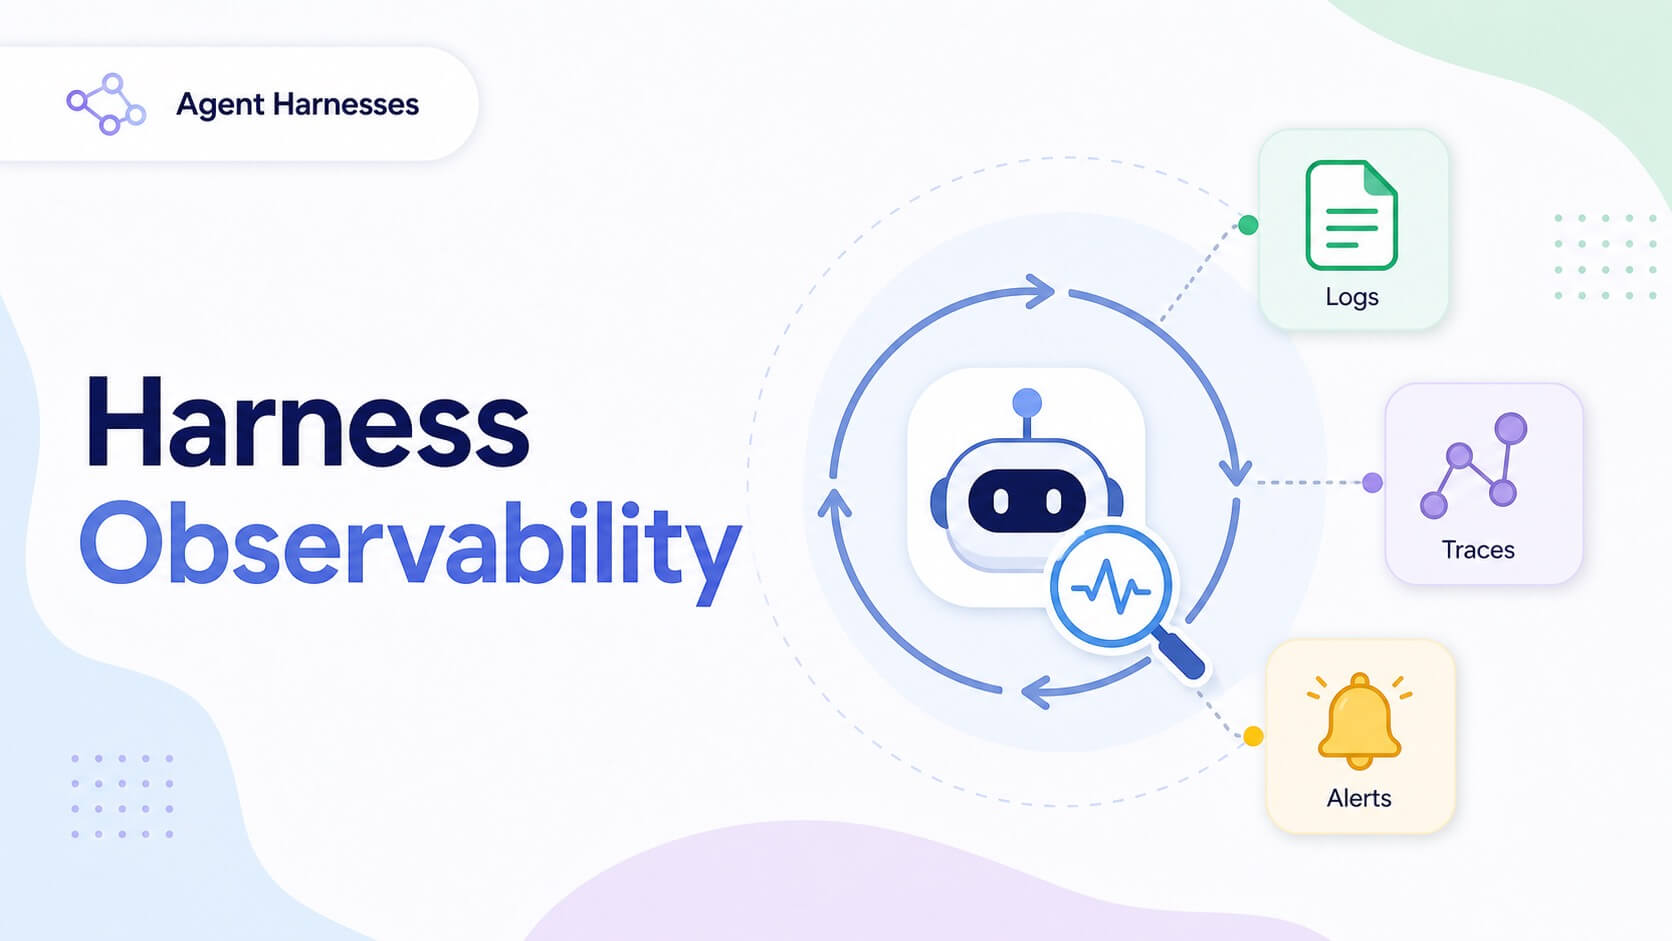
This is Blog 05 in the Agent Harnesses series. Blog 01 is useful background on what harnesses are, but you don't need it to follow this one. It covers the minimum log schema, token accounting, stuck-agent detection, multi-agent tracing, privacy, and closing the loop from production failures to evals.
The minimum log schema
Start here. Before any tracing infrastructure, before any observability platform, log every harness event as a structured JSON object. One event per line. One file per session. That's it.
Here's what each log entry should contain at minimum:
{
  "timestamp": "2026-05-07T14:23:01.412Z",
  "session_id": "ses_a1b2c3d4",
  "trace_id": "4bf92f3577b34da6",
  "iteration": 7,
  "event_type": "tool_call",
  "tool_name": "read_file",
  "tool_inputs": { "path": "/src/main.py" },
  "tool_output_hash": "sha256:...",
  "tool_output_truncated": "File read (1,842 tokens, truncated)...",
  "input_tokens": 12400,
  "output_tokens": 341,
  "cache_creation_tokens": 4200,
  "cache_read_tokens": 8000,
  "cumulative_tokens": { "input": 58200, "output": 1820 },
  "stop_reason": "tool_use",
  "latency_ms": 1820,
  "model": "claude-sonnet-4-6",
  "agent_id": "agent_root",
  "parent_agent_id": null
}
Two fields get systematically underestimated: stop_reason and cumulative_tokens.
stop_reason tells you why the model stopped generating. The vocabulary matters:
tool_use: model issued tool calls, loop continues as expectedend_turn: model produced a final answer, loop exits cleanlymax_tokens: context window hit the ceiling. This needs immediate attention.circuit_breaker: your harness killed the loop (you configured this deliberately)error: a tool threw an exceptionuser_interrupt: something upstream stopped execution
If you see max_tokens in your logs more than occasionally, you have a context
management problem, not a model problem. The harness let the context grow unchecked.
cumulative_tokens gives you a running total across the session. Plot input
tokens against iteration number and you'll immediately see if context is ballooning linearly
(expected) or exponentially (someone's tool output is enormous and getting re-injected every turn).
Structured JSON, not free text
Free text logs look like this:
[14:23:01] read_file called on /src/main.py, returned 1842 tokensThat's fine for reading in a terminal. It's useless at scale. You can't filter, aggregate, or query it without regex that breaks on any wording change.
Structured JSON means you can ask: "How often does read_file fail across sessions?"
with a single filter query. "What is the P95 latency for tool calls this week?" Same filter.
"Which sessions burned more than 200k tokens?" Trivial. The schema is the contract.
Keep field names stable across deployments, because changing them breaks every downstream query silently.
The fastest path to baseline visibility
You don't need Datadog on day one. The fastest path is hook-based JSONL logging. Write a hook script that fires on every tool call event and appends a JSON object to a file. No infrastructure. Readable immediately from the filesystem. Greppable.
Claude Code already does this. Sessions are stored under
~/.claude/projects/<encoded-cwd>/*.jsonl, one JSON object per line,
capturing every user prompt, Claude response, tool call, and timestamp. Several community
tools parse these files directly for dashboards and replay
(claude-session-dashboard,
agents-observe,
agent-flow).
That's a reference implementation you can borrow from.
OpenTelemetry for agent loops
JSONL on the filesystem works for one agent on one machine. Once you have multiple agents, multiple services, or a team that needs to share session data, you need a trace.
OpenTelemetry (OTel) is becoming the standard for agent telemetry. Every major agent framework (LangGraph, CrewAI, Autogen, SmolAgents, Agno) is converging on OTel exports. The benefit is vendor neutrality. You instrument once and route to Phoenix, Langfuse, Datadog, Honeycomb, or anything that accepts OTLP. Swap backends without re-instrumenting.
Mapping agent concepts onto OTel primitives
| OTel concept | Agent loop equivalent |
|---|---|
| Trace | Full agent session (session_id = trace_id) |
| Span | Single model call, tool execution, or subagent delegation |
| Parent span | One iteration of the agent loop |
| Child span | An individual tool call or nested subagent |
| Span event | Mid-span events: token stream chunks, retry attempts |
| Baggage | Context propagated across agent, tool, and subprocess boundaries |
The GenAI semantic conventions
The OTel GenAI semantic conventions define a standard schema for tracking model calls across providers. These are the span attributes that matter for Anthropic specifically:
gen_ai.system                        = "anthropic"
gen_ai.operation.name                = "chat"
gen_ai.request.model                 = "claude-sonnet-4-6"
gen_ai.response.model                = "claude-sonnet-4-6"
gen_ai.usage.input_tokens            = 12400
gen_ai.usage.output_tokens           = 341
gen_ai.usage.cache_creation.input_tokens = 4200
gen_ai.usage.cache_read.input_tokens = 8000
These attributes give you a consistent vocabulary across every provider you use. When you switch from one model to another, or add a second provider, your dashboards don't break because the field names are the same.
For spans covering agent-specific work, Arize Phoenix defines a useful taxonomy of span
kinds: CHAIN, LLM, TOOL, RETRIEVER,
EMBEDDING, AGENT, RERANKER, GUARDRAIL,
EVALUATOR. Use these labels consistently and your waterfall views will
actually tell you something.
Claude Agent SDK and W3C traceparent
The Claude Agent SDK reads TRACEPARENT and TRACESTATE from its
environment when starting each interaction span. When tracing is active, bash and PowerShell
subprocesses automatically inherit TRACEPARENT. That means shell commands your
agent runs are automatically part of the trace, without any manual instrumentation.
To export Claude Code telemetry to your backend:
export OTEL_EXPORTER_OTLP_ENDPOINT=https://your-backend:4317
export OTEL_EXPORTER_OTLP_HEADERS="Authorization=Bearer <token>"
For Langfuse specifically, the Python path uses configure_claude_agent_sdk()
with an OTel exporter pointed at the Langfuse endpoint. For JS/TS, the
ClaudeAgentSDKInstrumentation library from OpenInference auto-instruments SDK
calls. The
Langfuse integration docs
cover the exact setup.
The Claude Console (for managed agents) has built-in session tracing with a visual timeline. If you're self-hosting, OTLP export is the recommended path. See the Claude API session tracing docs for the full reference.
Token accounting
Every Anthropic API response includes a usage block. Read it every turn and
log it. At production scale, there is no acceptable reason not to.
{
  "usage": {
    "input_tokens": 12400,
    "output_tokens": 341,
    "cache_creation_input_tokens": 4200,
    "cache_read_input_tokens": 8000
  }
}
input_tokens is the total input processed: system prompt, tool definitions,
full conversation history. output_tokens is what the model generated.
cache_creation_input_tokens are tokens written to the prompt cache this turn
(billed at 1.25x base for a 5-minute TTL, 2x for 1-hour TTL).
cache_read_input_tokens are tokens served from cache (0.1x base, ten times
cheaper than fresh input).
What cache_control looks like in your logs
When you mark a block with cache_control: {"type": "ephemeral"}, Anthropic
caches the prompt prefix up to and including that block. On subsequent calls, if the prefix
matches, those tokens become cache_read_input_tokens instead of
input_tokens.
In your logs, the pattern looks like this:
- Turn 1: high
cache_creation_input_tokens, near-zerocache_read_input_tokens - Turn 2+:
cache_read_input_tokensrises sharply, cost per call drops
ProjectDiscovery documented a 59% LLM cost reduction using prompt caching, with
cache_read_input_tokens reaching over 80% of total input tokens after the
first turn. Tool definitions are the best candidates for caching since they're large,
stable, and prepended to every call. If you're not caching them, you're paying full rate
for the same tokens on every iteration.
The context burn chart
Build this one chart and keep it. Plot iteration number on the x-axis, cumulative input tokens on the y-axis, per session. A healthy session looks like a gradual slope. A runaway session looks like a hockey stick. If you're seeing hockey sticks, a tool is returning massive outputs and they're all staying in context.
Set alerts when session_total_input exceeds your threshold. Set a second
alert on spend velocity (e.g. $50/hour), not just per-session cap. A session cap catches
long sessions. A velocity cap catches fast runaway loops before they do serious damage.
You need both.
Detecting a stuck agent
An agent gets stuck when it calls the same tool with the same arguments and gets the same output, but keeps calling it anyway. The model doesn't realize it's repeating itself. There's no built-in "are we making progress?" signal in the agent loop. That signal has to come from your harness.
The important point is that loop detection belongs inside the harness. Third-party harness builders should implement it directly instead of waiting for a model to notice repetition on its own.
These patterns work in practice:
Pattern 1: Tool fingerprint hashing
Hash (tool_name + sorted(tool_inputs)). If the same fingerprint appears
two or three consecutive times with the same output hash, the agent is stuck. Keep a
sliding window of the last five tool call fingerprints and check for repeats.
Two to three repetitions is the practical trigger in production.
Pattern 2: Output hash tracking
Track the hash of the model's text response across turns. If the semantic content is nearly identical (cosine similarity above 0.95, or exact hash match) for three or more consecutive turns, the model is looping its reasoning without making progress. Flag it.
Pattern 3: Thrashing detection
Keep a sliding window of the last N tool calls. If the sequence alternates ABABAB between two tools, the agent is bouncing between two states. Exit after K oscillations. This pattern shows up a lot when an agent is trying to confirm an action, failing, and retrying the setup step indefinitely.
Pattern 4: Context drift
As context grows, models can lose track of the original goal. The symptoms are recognizable: increasingly generic responses, restating the task without acting on it, tool call arguments becoming vaguer. If you're not catching this with the above heuristics, look at the semantic drift in consecutive outputs.
Pattern 5: Hard stops (non-negotiable)
Every agent loop must have an absolute hard stop. Not a soft limit. An actual kill switch.
- Max turn count (e.g. 50 iterations)
- Max elapsed time (e.g. 10 minutes)
- Max token consumption (e.g. 500k input tokens per session)
These live in your harness, not in a prompt. A prompt-level instruction like "stop after 50 steps" is something the model can forget, ignore, or reinterpret. A harness-level kill switch is not. The system running the agent is ultimately responsible for guaranteeing termination. The model is not.
Circuit breakers
A circuit breaker is a control in your harness that monitors agent behavior against predefined thresholds and terminates execution when those thresholds are exceeded. The key word is "harness." An agent stuck in a loop cannot talk its way past a budget ceiling that lives outside its own context.
Four dimensions your circuit breaker should enforce:
- Iteration limit - maximum steps before forced termination
- Budget ceiling - hard cost limit in dollars or tokens per session
- Failure threshold - N consecutive errors on the same operation triggers a stop
- Scope enforcement - permission boundary violations trigger immediate termination and logging
When a circuit breaker trips, the escalation sequence should be:
- Stop the agent immediately. Don't let it complete the current turn.
- Save the full session state to a crash dump file.
- Log the trip reason: which threshold, what the agent was doing.
- Emit an alert (webhook, Slack, PagerDuty) with session ID, iteration count, cost to date, last tool called, and last model output.
- If escalation is configured: page an engineer with a session replay link.
The session replay link is what makes a tripped circuit breaker actionable. Without it, you know something went wrong. With the link, you can see exactly what.
Multi-agent tracing
A single user action might trigger an orchestrator that spawns three subagents, each of which makes tool calls. Tracing this correctly means attributing every cost, every failure, and every latency spike back to the specific agent that caused it.
W3C traceparent propagation
The approach:
- Root agent creates a trace and assigns a trace ID.
- When spawning a subagent, inject
traceparent(W3C format) into the subagent's environment or initialization params. - Subagent starts a new child span under the parent trace, not a new trace.
- All tool calls from the subagent appear nested under the subagent's span, which nests under the orchestrator's span.
In the Claude Agent SDK, when tracing is active, subprocesses automatically inherit
TRACEPARENT. You get this for free for anything the agent shells out to.
For MCP servers, OTel context can be propagated between the MCP client and server,
unifying the trace across that boundary too.
What a correct multi-agent trace looks like
The waterfall view should show:
- Root span: the orchestrator session
- Child spans: each subagent invocation (with
agent_idandparent_agent_id) - Grandchild spans: each tool call within each subagent
- Cost attribution: which agent spent how much
- Latency waterfall: which subagent or tool is the bottleneck
Langfuse handles this well. It supports multi-service LLM pipeline tracing with
@observe decorators and contextvars for thread-safe context
management across async boundaries and subagent threads. The automatic hierarchy is:
parent agent trace, child span per tool call, nested span per subagent delegation.
Privacy and log security
Agents read files, hit APIs, query databases, and write code. Everything they touch passes through prompts and tool outputs, which may end up in your logs. This is not hypothetical. Snyk's research found 280+ OpenClaw skills actively exposing API keys and PII through tool call logs and session histories.
Categories of sensitive data that routinely appear in agent logs:
| Category | Examples |
|---|---|
| API keys / secrets | AWS keys, Stripe keys, OAuth tokens in tool inputs |
| PII | Names, emails, SSNs in files the agent reads |
| Financial data | Database query results with account numbers |
| Health records | HIPAA-covered content in documents the agent processes |
| Internal credentials | DB connection strings, .env file contents |
| Source code | Proprietary code or code with embedded secrets |
What to never log raw
- API keys or tokens, even test keys
- Full contents of files the agent reads (log path + byte count + hash instead)
- Database query results that may contain user PII
- Environment variable dumps
- Multi-line private key material
- OAuth or session tokens from API responses
Redact before writing, not after
The redaction pipeline order matters. The original unredacted content should never reach central storage:
- Tool output arrives
- Redaction layer runs (pattern matching for PII types and secrets patterns)
- Redacted version is written to the log
- If the raw version is needed for debugging, store it in a separate high-security store with access controls
Microsoft Presidio handles common PII pattern detection well. For secrets specifically, the patterns need to be broad. Secrets rarely show up as tidy environment variables. They show up buried in whatever text an API returned or a file contained. Test your pattern library against real log samples, not idealized ones.
Retention and access controls
- Most agent logs should expire after 30 to 90 days unless they're compliance-required audit trails
- Separate redacted logs (broad access) from full-fidelity logs (restricted access)
- Encrypt logs at rest
- For GDPR and CCPA: logging full user-provided content without redaction may be a violation, not just a risk
Session replay
A session replay is the ability to re-execute (or inspect) an agent run step by step, using the same inputs, the same tool responses, and the same intermediate state. It turns a failure into something you can step through and reproduce.
JSONL is the natural foundation. Events serialized as JSONL are append-safe, streamable, greppable, and loadable incrementally without special tooling. Every LLM call, tool use, decision point, and state change goes into the file. Replaying it means reading events in order and stepping through the same path.
One practical issue to handle: corrupted session JSONL files.
Incomplete tool_use blocks or stop_sequence interruptions can
truncate a JSONL file mid-write. Your harness should validate the schema on load and
handle truncated files gracefully instead of crashing. This is a real production issue,
not a theoretical one.
Several tools support replay at different levels of sophistication.
AgentOps
has a session replay dashboard with point-in-time precision.
agent-flow
watches ~/.claude/projects/ and supports JSONL file replay directly.
LangGraph's Time Travel feature uses checkpoint-based state persistence that lets you
branch at any checkpoint, not just replay from the start.
From logs to evals
Production logs are raw material for eval datasets. The agent runs, logs are captured. Sessions with anomalies get flagged and go into an annotation queue. Engineers label them: "this session failed because X." Those labeled sessions become regression test cases. Regression tests run on every harness change. Each iteration expands coverage.
Real-world failures become the tests that prevent the same failure from reaching users again. The dataset stays current because production never stops generating new edge cases.
Which sessions to flag for eval harvest
- Sessions that tripped a circuit breaker
- Sessions where
stop_reasonwasmax_tokens - Sessions with consecutive tool errors
- Sessions with iteration count above the P90 for your workload
- Sessions with cost above the P95
- Sessions that required human escalation
- Sessions flagged by users as incorrect or unhelpful
Trajectory evals, not just output evals
An output eval asks: "Did the final answer match what was expected?" Binary and easy to automate. A trajectory eval asks: "Did the agent take a sensible path to get there?" Richer signal, harder to automate, but it requires logs to run at all.
You want both. An agent can arrive at the correct answer via a completely broken path that happens to recover. Knowing the output was right tells you nothing about whether the harness will hold up next time on a slightly different input.
Braintrust, Langfuse, and LangSmith all support adding flagged production traces to eval datasets directly from their UIs. Braintrust's CI/CD integration can block merges when quality degrades below a threshold. That's the loop closing properly.
Platform comparison
A quick comparison:
| Platform | Best for | What sets it apart |
|---|---|---|
| Langfuse | Open-source first, self-hosted control | OTel-native, multi-turn tracing, self-hostable, free tier (50k obs/month) |
| Arize Phoenix | Open-source, framework-agnostic | 10 span kinds, broad auto-instrumentation, OTel-native, free OSS |
| Braintrust | Eval-driven teams, CI/CD integration | One-click log-to-eval, CI/CD blocking on quality regression |
| AgentOps | Framework-agnostic, fast setup | 400+ integrations, session replay, single decorator instrumentation |
| Helicone | API gateway-first, cost tracking | One-line proxy integration, unified gateway across providers |
| W&B Weave | ML teams already on W&B | MCP auto-logging, code/data/metadata lineage tracking |
| LangSmith (LangChain) | LangChain/LangGraph stacks | Zero-code setup for LangGraph, best debugging UX for LangGraph |
| Datadog LLM Observability | Teams already on Datadog | Integrated with existing APM, OTel GenAI semantic convention support |
If you're starting fresh with no existing observability stack: Langfuse or Phoenix, both open-source, both OTel-native. If you need eval automation from day one: Braintrust. If you're already in LangGraph: LangSmith with near-zero setup overhead.
The point
The observability layer is not overhead. It's how the harness gets better over time. A blind agent doesn't improve. You don't know what it's doing, why it failed, or what path it took to get the wrong answer.
Log every event as structured JSON. Add the trace IDs. Read the usage block on every turn. Build the stuck-agent detection before you hit production. Set hard stops that live in your code, not in your prompts. Redact before writing. Replay sessions when things break. Feed failures into evals so the same failure can't happen twice.
This is what makes a harness worth running in production.
Next in the series: Blog 06 covers cost at scale. Why a 1,000-token system prompt is worth engineering for, and what the difference between Pi's lean prompt and Claude Code's 10,000-token one actually costs at 6.5M monthly developers.
References and sources
Official documentation
- OpenTelemetry GenAI Semantic Conventions - attributes, span kinds, and metrics for LLM and agent spans
- OTel GenAI Spans Spec - full reference for
gen_ai.operation.name, token fields, and cache attributes - OTel AI Agent Observability Blog (2025) - evolving standards and state of the art
- Claude API: Session Tracing - TRACEPARENT propagation and OTel export for Claude Agent SDK
- Anthropic Prompt Caching Docs - cache_control, token fields in the usage block
- Claude Code Monitoring - official monitoring guidance
Engineering posts and analyses
- ProjectDiscovery: 59% LLM Cost Reduction with Prompt Caching - real numbers on cache_read token impact
- Snyk: 280+ Leaky Skills - OpenClaw and ClawHub Credential Exposure - API key and PII exposure through agent logs
- DEV.to: How to Tell If Your AI Agent Is Stuck - real data from 220 agent loops
- Cresta: Multi-Service LLM Pipeline Tracing with Langfuse
- SigNoz: Claude Code Monitoring with OpenTelemetry
- Replayable Agent Runs: The Debugging Trick That Ships
- Debugging Non-Deterministic LLM Agents: LangGraph Time Travel
- Braintrust: Connecting Production Logs to Real-World Test Data
- Rafter: AI Agent Data Leakage and Secrets Management
- Maxim AI: Troubleshooting Agent Loops - Patterns, Alerts, and Safe Fallbacks
Platform documentation
- Langfuse: Claude Agent SDK Integration - Python and JS/TS setup
- Arize Phoenix GitHub - open-source OTel-based observability
- AgentOps Documentation - SDK-based agent monitoring
- W&B Weave Documentation - agent tracing and MCP auto-logging
- Helicone: The Complete Guide to LLM Observability Platforms
- Braintrust: Best AI Observability Platforms 2025
Community tooling
- disler/claude-code-hooks-multi-agent-observability - hook-based real-time monitoring
- simple10/agents-observe - real-time Claude Code multi-agent observability
- patoles/agent-flow - real-time visualization with JSONL replay support
- dlupiak/claude-session-dashboard - local observability dashboard for
~/.claudesessions - hoangsonww/Claude-Code-Agent-Monitor - SQLite + Node.js + React monitoring dashboard
Rahul Kashyap is CTO & Co-founder at Designare Studio and DeepStory, based in Bangalore.